Independent Research
Perception-Reality Gaps in AI Linguistic Bias
AI didn't answer non-native English speakers worse. It answered them longer, and they couldn't tell.
Challenge
We measured AI bias, but never asked the people it affects
Prior computational work has reported that language models respond differently to non-standard varieties of English. That research measures the model. It doesn't ask whether the people on the other side of the screen perceive any difference, and perception is what drives trust and everyday use.
If non-native English speakers (NNES) overestimate bias, they may avoid tools that would help them. If they underestimate it, they may rely on output that treats them differently. Either way, the gap between reality and perception is a product problem, not only a fairness metric. I asked two questions: do LLMs respond measurably differently to the same request written by native and non-native speakers, and can NNES users detect those differences?
Approach
Measure reality and perception on the same AI outputs
A sequential mixed-methods design. An audit established what the models actually do, and its outputs became the stimuli for the user study, so I could compare what people perceived against a measured ground truth.
Computational audit
150 matched prompt pairs across professional, information, and creative tasks, each sent 5 times to GPT-4o, Gemini 2.5 Flash, and Claude Sonnet 4.6. That produced 4,500 responses, compared on semantic similarity (SBERT), readability (Flesch-Kincaid), and length.
User study
60-minute remote sessions with 8 NNES: a 12-pair detection task built from audit outputs, a perception and trust survey, disclosure of the audit finding, and a semi-structured interview coded across six categories.
Why real writers, not my own prompts
I recruited 20 people (10 native, 10 non-native across Korean, Hindi, Mandarin, and Cantonese first languages) to write prompts from the same scenarios, with no AI help. Researcher-written "non-native" English would have tested my stereotypes, not real usage.
Why Signal Detection Theory
Plain accuracy mixes up two things: whether people can see a difference, and how willing they are to say one exists. SDT separates sensitivity (d′) from response bias (c).
Why disclose before the interview
Measuring detection first kept perception uncontaminated. Revealing the finding afterward let me hear how people made sense of it in their own words.
Findings
My hypothesis didn't hold. A quieter pattern did.
Quality looked the same
I expected degraded or condescending answers for non-native prompts. Across all three models, readability (|d| 0.05 to 0.08) and semantic similarity (d 0.08 to 0.13) showed negligible, non-significant differences.
But non-native prompts got longer answers
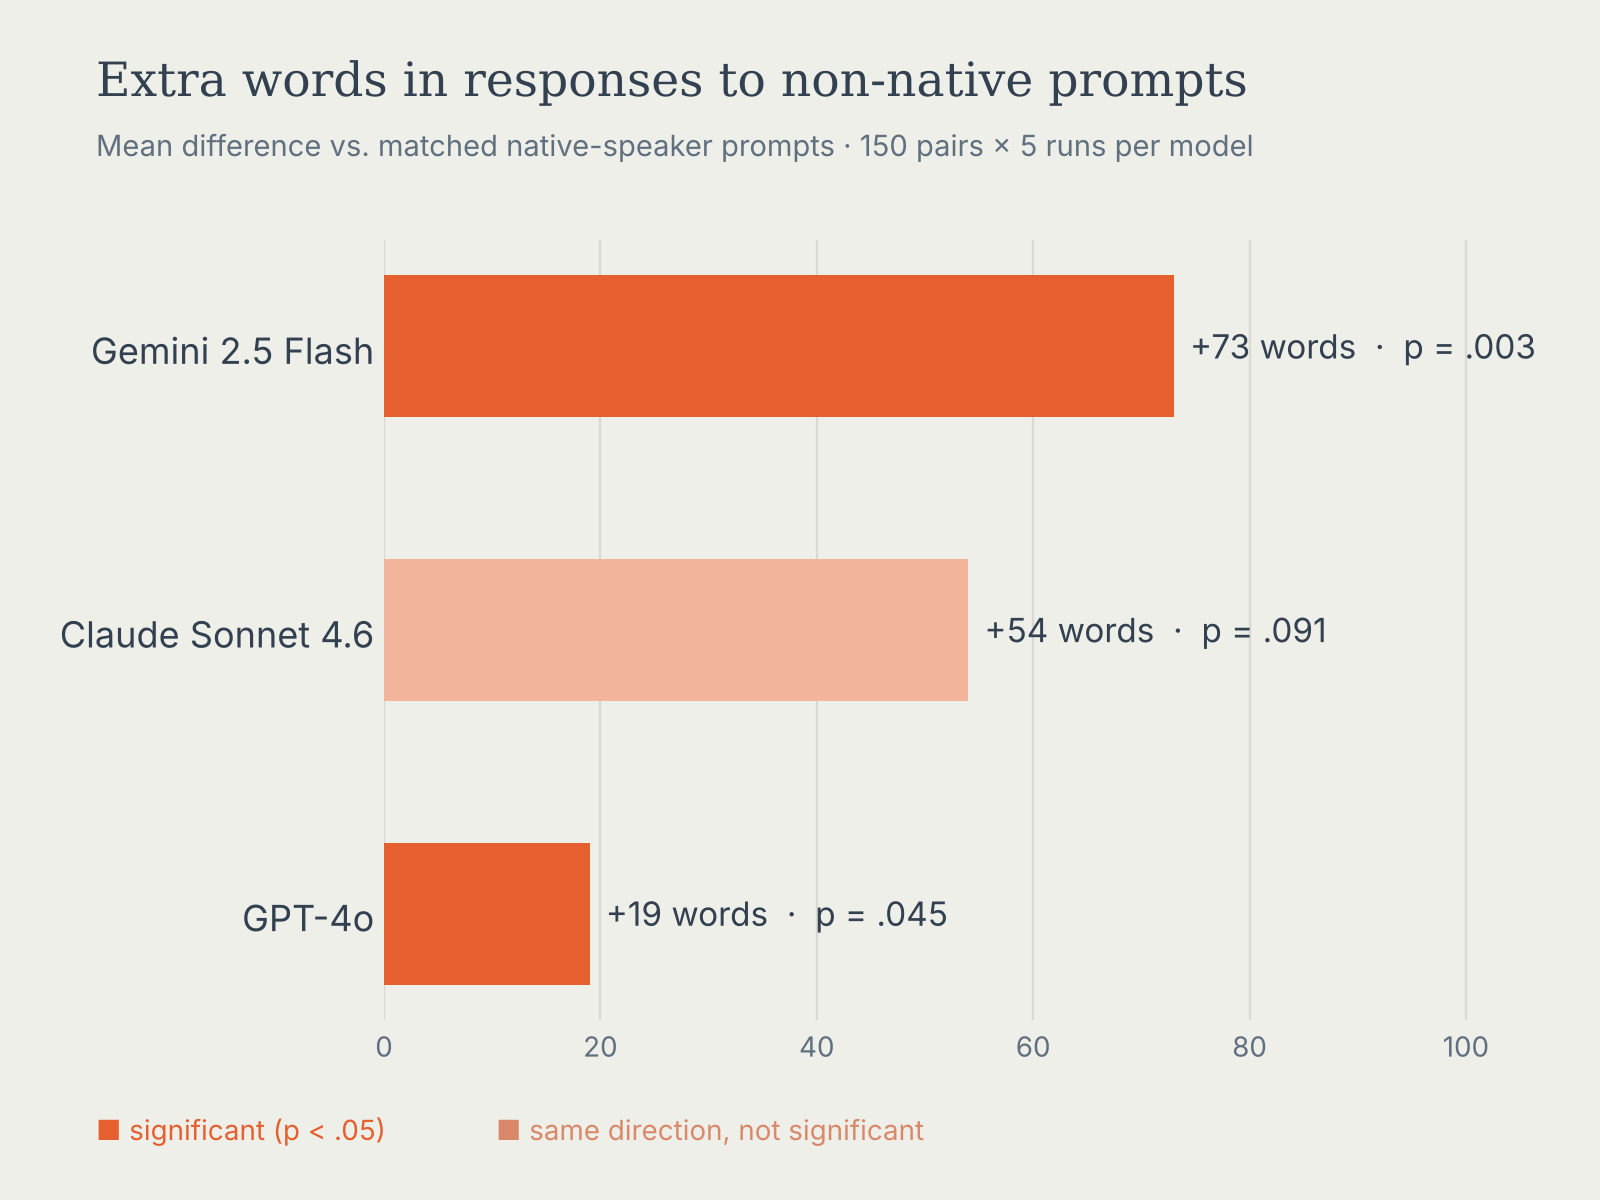
Every model wrote more for non-native prompts: +19 words for GPT-4o, +54 for Claude, +73 for Gemini. The direction was consistent across vendors with different training pipelines, which points to a broader behavior rather than one product's quirk.
Users couldn't see the difference
Across 96 detection trials, group sensitivity was d′ = 0.17, barely above chance. On the survey, 5 of 8 participants rated the quality difference as none, and nobody reported a large gap in either direction.
Once told, they read it as help
After disclosure, 7 of 8 said longer answers matched what they already expected. They explained it as the AI compensating for an unclear prompt, not as being treated differently because of their English.
Three interview themes
Self-attribution is the default. When an answer felt off, participants blamed their own English first, regardless of proficiency.
Verbosity noticed, never labeled. Some had noticed long answers, but none connected them to being a non-native speaker until shown the data.
Trust follows the stakes. People verified output for work and academic writing and relied freely on low-stakes tasks, whatever they believed about bias.
What changed
From "is AI biased?" to "is the difference visible?"
Before this study, bias research measured models in isolation and assumed differences would show up as lower quality. User perception had never been measured against the same outputs. This work adds a replicable protocol that pairs an audit with a perception study, and evidence that the real difference is in length, is reproducible across vendors, and is invisible to the users it affects.
Obstacles
Three moments that shaped the work
The hypothesis failed
Quality metrics came back flat. Instead of forcing the original story, I looked at what did vary and rebuilt the user study around the length finding.
A session recording was lost
One session had to be reconstructed from my notes, and its detection score was an outlier. I kept it, flagged it, and reported results with and without it (d′ 0.17 vs. 0.32) so the conclusion didn't hinge on one case.
Peer review pushed back
After review feedback on a conference submission, I restructured the paper to lead with the audit, where the evidence was strongest, and I'm strengthening it with additional audit methods.
Potential product impact
How a product team could use this
These are implications I'd propose to a product team, not changes that shipped.
- Break evaluation metrics out by user language background. Aggregate quality scores hid this effect. Length and verbosity should be tracked per segment, not only overall.
- Don't rely on user feedback to surface it. If people can't detect a difference and blame themselves when they do, thumbs-down signals won't catch it. Detection has to happen system-side.
- Treat length as a cost, not a gift. Longer answers mean more reading in a second language. Response length controls could matter more for non-native speakers than for anyone else.
Retrospective
What I'd do differently
My instruments were built to detect lower quality, so a length-focused detection task from the start would have tested the real finding more directly. Losing one recording taught me to run local and cloud recording in parallel by default. And eight participants gave depth but limited statistical power. The next step is a larger survey to test whether near-chance detection holds at scale.